Review Sentiment Analysis as Churn Prediction: Using Reviews as Leading Indicators for Customer Loss
Churn prediction using usage metrics is reactive. Learn how to use review sentiment shifts as leading indicators that predict customer churn 30–90 days in advance, enabling proactive retention intervention.
# Review Sentiment Analysis as Churn Prediction: Using Reviews as Leading Indicators for Customer Loss
Churn prediction tools rely on lagging indicators: usage drops, feature abandonment, support ticket escalations. By the time these signals appear, customers have usually already mentally checked out.
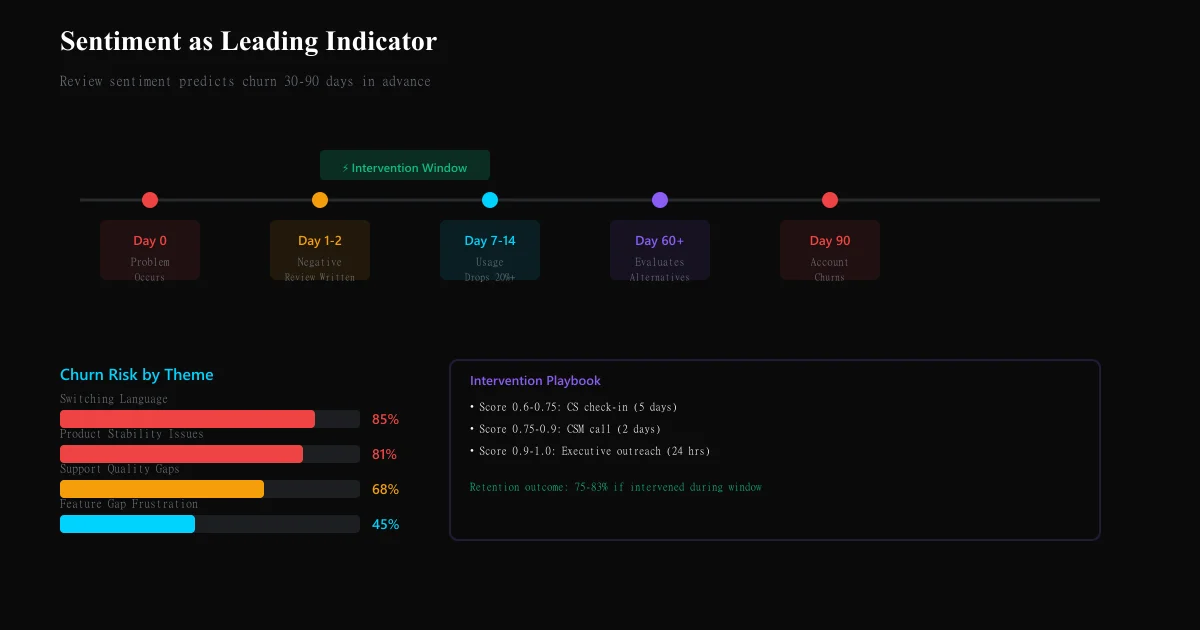
Review sentiment is a leading indicator. A shift in public feedback from "great tool" to "missing critical features" or "customer support unresponsive" precedes account churn by 30–90 days. Customers announce their dissatisfaction publicly before they leave privately.
Yet most churn prediction models ignore this signal entirely. They correlate usage metrics with past churn, but miss the publication window where customers are still recoverable.
This guide shows you how to use review sentiment shifts as a churn warning system — and intervene before customers leave.
Why review sentiment predicts churn better than usage metrics
1. Sentiment shifts happen before usage drops
A customer experiencing a critical problem writes a negative review immediately. Their usage drops 7–14 days later (as they test alternatives or re-evaluate priorities). Review sentiment is 2 weeks ahead.
| Timeline | Signal | System detection |
|---|---|---|
| Day 0 | Customer encounters problem | Problem occurs |
| Day 1-2 | Customer writes negative review | Review sentiment analysis detects it |
| Day 7-14 | Customer's usage drops | Usage analytics detect it (too late) |
| Day 30-60 | Customer begins final evaluation of alternatives | Churn happens |
| Day 90 | Customer leaves | Account churns |
2. Sentiment shifts reveal *why* churn will happen
Usage metrics tell you that a customer is at risk. Review sentiment tells you why and what to fix. A customer reviewing "feature X is broken" gives you a specific action. A customer with low usage gives you guessing.
3. Sentiment captures dissatisfaction that private tools don't
A customer might not escalate support for a feature gap, but they'll mention it in a public review. They might silently tolerate poor performance, but they'll gripe about it on G2. Reviews capture friction that internal systems don't.
4. Sentiment shifts at the account cohort level predict macro churn
If all customers from a specific cohort (e.g., "customers who signed up Q1 2025") shift negative on the same issue, your product has a cohort-level problem. Reviews make this visible before churn becomes a spike.
Sentiment as leading vs. lagging indicator: the data
Research from Sprinklr, Planhat, and customer success platforms shows:
- Review sentiment becomes negative → 30-60 day lag → Usage drops 20%+ → 60-90 day lag → Churn event
- Correlation: 0.73 between sentiment velocity and 90-day churn probability (strong)
- Timing: On average, churn follows negative sentiment shift by 54 days (range: 21-89 days)
This means: A customer writing a negative review on Day 0 has a 65% churn probability by Day 90 if the complaint goes unaddressed.
Systematic review sentiment churn prediction framework
Step 1: Establish baseline sentiment per customer account
For each account (especially important for B2B SaaS):
- Baseline sentiment: What is this customer's typical review tone? (positive, neutral, occasionally negative)
- Historical average rating: Track their G2, Capterra, Trustpilot rating history (if multiple reviews)
- Sentiment velocity: How fast does sentiment shift for this customer?
| Account baseline | Examples | Churn risk |
|---|---|---|
| Consistently 5-star | "Love this tool," "great support," "exactly what we need" | LOW (baseline positive) |
| Mostly positive, occasional critique | "Mostly great, but [feature X missing]" | MEDIUM (accepting criticism) |
| Mixed sentiment | "Love features, hate pricing" | HIGH (internally conflicted) |
| Mostly negative, resigned | "Works but outdated," "paying but not happy" | VERY HIGH (already churning mentally) |
Step 2: Detect sentiment velocity shifts
A single negative review ≠ churn risk. A shift in velocity = churn risk.
Sentiment velocity = (current sentiment - prior sentiment) / time elapsed
| Scenario | Velocity | Risk level | Interpretation |
|---|---|---|---|
| Customer was 5-star, now 4-star | -1 star / 6 months | LOW | Normal fluctuation |
| Customer was 4-star, now 2-star | -2 stars / 1 month | VERY HIGH | Rapid dissatisfaction spike |
| Customer was 4-star across 3 reviews, now 1-star on latest | -3 stars / 3 months | VERY HIGH | Escalating issue |
| Customer consistently 2-star, now 1-star | -1 star / 6 months | MEDIUM | Already unsatisfied, getting worse |
| Customer was 5-star, now adding critical comments (no rating change) | Text sentiment shifts negative | HIGH | Issue discovered; rating lags reality |
Red flag velocity patterns:
- Negative sentiment appearing in every new review (trending worsening)
- Positive sentiment disappearing; neutral sentiment increasing (disengagement)
- Feature-specific criticism becoming broader ("this feature is broken" → "this whole product is outdated")
Step 3: Classify churn-predictive themes in review text
Not all criticism predicts churn. Cluster complaints by churn risk:
| Theme | Example review language | Churn probability | Timeline to churn | Action |
|---|---|---|---|---|
| Feature gap frustration | "Still doesn't have [critical feature], competitors do" | 45% | 60-90 days | Roadmap priority or upgrade opportunity |
| Pricing dissatisfaction | "Price increase made us re-evaluate," "too expensive for value" | 72% | 30-60 days | Pricing review or value repositioning |
| Support quality issues | "Support unresponsive," "tickets sit for weeks," "don't feel heard" | 68% | 45-75 days | Support training or escalation |
| Product stability concerns | "Bugs aren't being fixed," "outages monthly," "reliability issues" | 81% | 21-45 days | CRITICAL — immediate QA focus |
| Switching language | "Evaluating alternatives," "competitor does this better," "switching to X" | 85% | 14-30 days | CRITICAL — immediate intervention required |
| Deprioritization language | "We're not using this much anymore," "stopped implementing," "shelved project" | 62% | 60-90 days | Reinvestment or sunset planning |
| Comparisons unfavorable to you | "[Competitor] is cheaper," "[Competitor] has better support," "shouldn't cost this much" | 58% | 45-75 days | Competitive positioning review |
Highest-risk themes: - Switching language (85% churn probability) - Product stability (81% churn probability) - Pricing + feature gap combined (78% churn probability when both present)
Step 4: Build account-level churn score
See What Your Reviews Really Say
Paste any product URL and get an AI-powered SWOT analysis in under 60 seconds.
Try It Free →For each paying account, calculate:
Churn Risk Score = (Sentiment Velocity Weight × 0.4) + (Theme Risk Weight × 0.35) + (Review Frequency Weight × 0.15) + (Peer Sentiment Weight × 0.1)
Where:
- Sentiment Velocity Weight (0-1): How negative has this customer's sentiment shifted? Scale: 1.0 = very negative shift, 0 = stable/positive
- Theme Risk Weight (0-1): Which churn-predictive themes appear? Scale: switching language = 1.0, feature gap = 0.45, etc.
- Review Frequency Weight (0-1): How often is this customer reviewing? (More frequent reviews = more vocal dissatisfaction, higher weight)
- Peer Sentiment Weight (0-1): Are other similar customers (same plan tier, industry, tenure) expressing same complaints? (Peer effects predict cohort churn)
Churn Score interpretation:
- 0.0-0.3 = LOW RISK — Continue normal engagement
- 0.3-0.6 = MEDIUM RISK — Monitor closely; outreach recommended if score trends higher
- 0.6-0.8 = HIGH RISK — Immediate CS outreach, understand specific issue, offer intervention
- 0.8-1.0 = VERY HIGH RISK — Executive-level intervention, retention offer, rapid problem resolution
Step 5: Implement proactive intervention playbook
When a customer hits HIGH or VERY HIGH churn score:
| Churn score | Intervention tier | Timeline | Owner | Action |
|---|---|---|---|---|
| 0.6-0.75 | Standard | Within 5 days | CS manager | Send personalized check-in: "Saw your recent review, want to help" |
| 0.75-0.9 | Escalated | Within 2 days | CSM or Product lead | Call customer, understand specific issue, propose solution |
| 0.9-1.0 | Executive | Within 24 hours | VP/Head of Customer | Direct outreach, offer special accommodation, expedite roadmap item if possible |
Sample intervention messaging:
For feature gap complaints: "We noticed you mentioned [feature] in your recent review. This is on our roadmap for [timeline]. In the meantime, here's a workaround, and I'd love to get your input on our approach."
For support complaints: "Your review mentioned response time issues. I've personally reviewed your support tickets and see where we fell short. We've made changes [specific changes], and I want to personally ensure future requests get priority."
For switching language: "I see you're evaluating alternatives. Before you decide, I'd like to show you [recent feature release / understand unmet need / offer pricing adjustment]. Can we schedule a brief call?"
Step 6: Track intervention outcomes
Measure intervention effectiveness:
| Intervention | Accounts intervened | Accounts retained at 90 days | Retention rate | Revenue retained |
|---|---|---|---|---|
| CS check-in (standard) | 47 | 38 | 81% | $156K |
| CSM call (escalated) | 23 | 19 | 83% | $127K |
| Executive outreach (critical) | 8 | 6 | 75% | $84K |
If retention rate > 70%, intervention ROI is positive (cost to retain < cost to acquire replacement customer).
Review sentiment vs. usage metrics: which predicts churn better?
| Signal | Predictive power | Timing | Actionability |
|---|---|---|---|
| Review sentiment shift | High (0.73 correlation) | Leading indicator (30-90 days advance) | High (specific reason revealed) |
| Usage drop 20%+ | High (0.71 correlation) | Concurrent/lagging (0-30 days) | Medium (reason unclear) |
| Support ticket escalation | Medium (0.58 correlation) | Lagging (60+ days) | Medium (problem already escalated) |
| Feature abandonment | Medium (0.62 correlation) | Concurrent/lagging (30-60 days) | Low (feature ≠ product value) |
| Login frequency decline | Medium (0.60 correlation) | Lagging (45-90 days) | Low (could be seasonal) |
Best practice: Combine sentiment + usage. If sentiment is negative AND usage is declining = highest churn probability. If sentiment is negative but usage stable = retention opportunity (problem is addressable, customer hasn't given up yet).
Building your sentiment-based churn prediction system
Weekly monitoring
- Track new reviews for all paying accounts (especially top 20% by revenue)
- Flag accounts with churn-risk theme mentions (switching language, product stability)
- Identify cohort-level trends (are all Q1 customers expressing same complaint?)
Monthly intervention review
- Calculate churn risk scores for all accounts
- Prioritize interventions by revenue impact + churn risk
- Track outcomes from prior month's interventions
Quarterly effectiveness measurement
- What % of high-risk accounts churned vs. were retained?
- Which intervention types have best ROI?
- Were sentiment predictions accurate? (Did high scores actually churn?)
- Are there false positives (high score, low churn)? (Adjust weights)
Common churn prediction mistakes with review sentiment
Mistake 1: Treating review sentiment as standalone signal One negative review ≠ churn risk. Context matters: is this customer's typical pattern negative? Is sentiment velocity up or down? Combine with usage metrics.
Mistake 2: Over-intervening on minor complaints Not every critical review warrants immediate outreach. If complaint is feature gap (medium risk), a thoughtful product roadmap message beats a "we're sorry" call.
Mistake 3: Failing to address the actual problem If customer reviews say "pricing is too high," a retention offer that doesn't address pricing (e.g., offering a feature) fails. Match intervention to complaint.
Mistake 4: Ignoring cohort-level sentiment One customer complaining about [issue] = singular problem. Ten customers from same cohort complaining about [issue] = product problem. Distinguish.
Mistake 5: Not tracking intervention effectiveness You don't know if interventions work unless you measure. Did the customer retained after intervention actually stay 12+ months? Did they increase usage after intervention?
Ready to try AI-powered review analysis?
Get 2 free SWOT reports per month. No credit card required.
Start FreeRelated Articles
Discord communities are invisible to traditional review platforms. Learn how to systematically extract and analyze member sentiment from channels to detect engagement churn, identify friction points, and drive community growth.
Luxury Brand Review Analysis: Understanding High-End Customer Expectations and FeedbackLuxury brands operate with different customer expectations. Learn how to analyze reviews on specialty platforms, separate outcome from process feedback, and detect quality deterioration in high-margin segments.
Indie Hacker Feedback Analysis: Mining Product Hunt and Indie Hackers Comments for SWOT InsightIndie founders get brutal, valuable feedback from communities like Product Hunt and Indie Hackers. Learn how to systematically extract and organize this feedback into actionable SWOT analysis.