Figma Plugin Marketplace Analysis: Optimizing Plugin Ratings Through User Review Feedback
Plugin developers compete on Figma marketplace visibility, which is driven by ratings. Learn how to analyze plugin reviews to identify rating drivers, fix deterioration, and optimize marketplace performance.
# Figma Plugin Marketplace Analysis: Optimizing Plugin Ratings Through User Review Feedback
The Figma plugin marketplace is brutal meritocracy. 7,000+ plugins compete for 1,000,000+ Figma users. Visibility is driven by:
- Rating (primary discovery signal)
- Installation count (social proof)
- Recency of updates (active development signal)
A plugin at 4.8⭐ with 5,000 installs dominates search. A plugin at 3.2⭐ with 500 installs gets buried. Yet most plugin developers treat ratings as immutable — something that happens to them, not something they can engineer.
This is wrong. Plugin ratings are a response to specific user experiences. Bad ratings are feedback about fixable problems. Developers who analyze review patterns and fix the underlying issues see rating velocity improve 0.5-1.0 stars within 30-60 days.
This guide shows plugin developers how to systematically analyze Figma marketplace reviews and optimize for ratings.
Why Figma plugin ratings matter more than other platforms
1. Ratings directly drive marketplace visibility
Figma's algorithm surfaces high-rated plugins first. A 4.8⭐ plugin appears in search before a 3.9⭐ plugin, even with fewer installs. Rating is a direct visibility lever.
2. Design tool users check ratings before trying
Unlike casual browser extensions, Figma plugins are mission-critical tools. Users check reviews before installing. A 3-star plugin has 60% conversion lower than a 4.5-star plugin at the same install count.
3. Review volume is low, so each review matters
Popular plugins get 20-50 reviews. Tier-2 plugins get 5-15 reviews. Each new review moves the rating significantly. A single bad review (1-star) on a 10-review plugin drops rating 0.2⭐. This is manipulable if you understand the drivers.
4. The ecosystem is still emerging
Plugin market leader positions aren't locked. First-mover advantage exists for high-quality plugins in each category. A developer shipping 2.0 with dramatically improved ratings can steal market share from established plugins.
Figma plugin review landscape and signal quality
Where reviews appear
Official Figma plugin marketplace — Only source. Figma controls review visibility, curation, and sorting. No reviews on third-party sites or Twitter.
Review visibility: - Star rating (1-5) - Written review text (0-3 sentences typical) - Author name (usually anonymous or first name only) - Review date - Version of plugin reviewed (if user mentions it)
Signal quality: HIGH — verified users (Figma account required), real installations, time-stamped usage
Bias: Users who write reviews skew negative (frustrated with bugs) and extreme positive (evangelists). Casual satisfied users don't review. Creates U-shaped distribution.
| Rating | Typical reviewer motivation |
|---|---|
| 5⭐ | "This plugin saved me hours" — evangelical evangelist |
| 4⭐ | "Works great, minor quibbles" — satisfied, willing to help |
| 3⭐ | "Does the job but missing [feature]" — acceptable but not delighted |
| 2⭐ | "Broken or incomplete" — frustrated, wants to warn others |
| 1⭐ | "Doesn't work" — very frustrated, venting |
Systematic Figma plugin review analysis framework
Step 1: Establish baseline rating and review distribution
For your plugin:
| Metric | What it reveals | Action if low |
|---|---|---|
| Overall rating | General user satisfaction | Below 3.5⭐ = serious problem requiring urgent action |
| Review count | Market awareness + feedback volume | < 5 reviews = insufficient signal; focus on activating reviewers |
| 5-star % | Evangelical satisfaction | < 40% = something critical is broken for many users |
| 1-star % | Frustrated users who feel compelled to warn others | > 15% = unacceptable experience for segment of users |
| Recency of reviews | Are recent changes helping or hurting? | If recent reviews declining in quality = recent update backfired |
Target benchmarks: - 4.5⭐+ = healthy, good marketplace position - 4.0-4.5⭐ = acceptable, but vulnerable to competitor plugins - < 3.8⭐ = serious marketplace positioning problem
Step 2: Extract and categorize review feedback
Read all reviews (if < 20 reviews, read all; if > 20, read latest 20 + all 1-star reviews):
For each review, extract: - Star rating - Core complaint or praise (1-2 sentences) - Feature mentioned (if any) - Bug or issue reported (if any) - Context about use case (if provided)
Categorize into themes:
| Theme | 5⭐ language | 1⭐ language | Red flag if present in multiple reviews |
|---|---|---|---|
| Functionality | "Works perfectly," "does exactly what I need" | "Doesn't work," "broken after update," "crashes" | Inconsistent plugin behavior, crash reports |
| Ease of use | "Intuitive," "easy setup," "quick to learn" | "Confusing interface," "hard to use," "unclear" | UX design problem, missing documentation |
| Performance | "Fast," "instant," "no lag" | "Slow," "hangs," "freezes," "laggy" | Performance regression or efficiency issue |
| Feature completeness | "Has everything I need," "covers all use cases" | "Missing [feature]," "incomplete," "limited" | Feature gap in core functionality |
| Integrations | "Works with my other tools," "seamless integration" | "Doesn't work with X," "broken integration," "no Figma API support" | Platform integration failure, technical limitation |
| Support | "Developer responds quickly," "great updates," "actively maintained" | "No support," "abandoned," "haven't updated in months," "issues never addressed" | Maintenance perception problem, abandoned feeling |
| Updates | "Regular updates," "bug fixes," "adding features" | "No updates," "broken since update," "new version worse" | Update cadence problem or regression in new version |
See What Your Reviews Really Say
Paste any product URL and get an AI-powered SWOT analysis in under 60 seconds.
Try It Free →Step 3: Identify rating drivers by comparing 5-star vs. 1-star reviews
What separates your happiest users from your most frustrated?
| Satisfaction driver | 5-star mentions | 1-star mentions | Insight |
|---|---|---|---|
| Performance | 8/12 reviews | 0/8 reviews | Performance is a strength |
| Ease of use | 6/12 reviews | 6/8 reviews | UX is problem area |
| Feature completeness | 4/12 reviews | 5/8 reviews | Missing features driving dissatisfaction |
| Support responsiveness | 3/12 reviews | 3/8 reviews | Developer responsiveness perceived as weak |
| Stability | 7/12 reviews | 2/8 reviews | Overall stability good, but crashes for some users |
Key insight: If 5-star reviews praise feature X and 1-star reviews complain about feature Y, you have a clear priority gap. Ship feature Y.
Step 4: Detect rating deterioration patterns
Compare ratings over time:
| Pattern | Example | Meaning | Action |
|---|---|---|---|
| Recent drop | Was 4.7⭐ six months ago, now 4.1⭐ | Recent update broke something or new problem | Revert update or fix immediately; message is that you've heard the issue |
| Sustained low | Always been 3.2⭐ | Core functionality problem | Major feature work or product repositioning needed |
| Volatility | Swings 4.5⭐ to 3.0⭐ | Inconsistent plugin behavior or regression in specific versions | QA/regression testing needed |
| Positive trajectory | Was 3.5⭐, now 4.1⭐ | Recent fixes are working | Continue trajectory; what changed? |
Timing matters: If rating dropped after specific version release, revert to prior version or hotfix. Users are telling you something.
Step 5: Competitive benchmarking from reviews
Compare your reviews to competitor plugins in same category:
| Competitor | Their rating | What users praise them for | What users criticize | Your differentiation gap |
|---|---|---|---|---|
| Competitor A | 4.6⭐ | Speed, integrations, regular updates | Missing [feature], support slow | Need to improve updates, feature parity |
| Competitor B | 3.9⭐ | Ease of use, beautiful UI | Bugs in [functionality], price | You have advantage if stable; emphasize it |
Users comparing you to competitors in reviews ("Works like Competitor A but cheaper"). These are switching criteria. Note them.
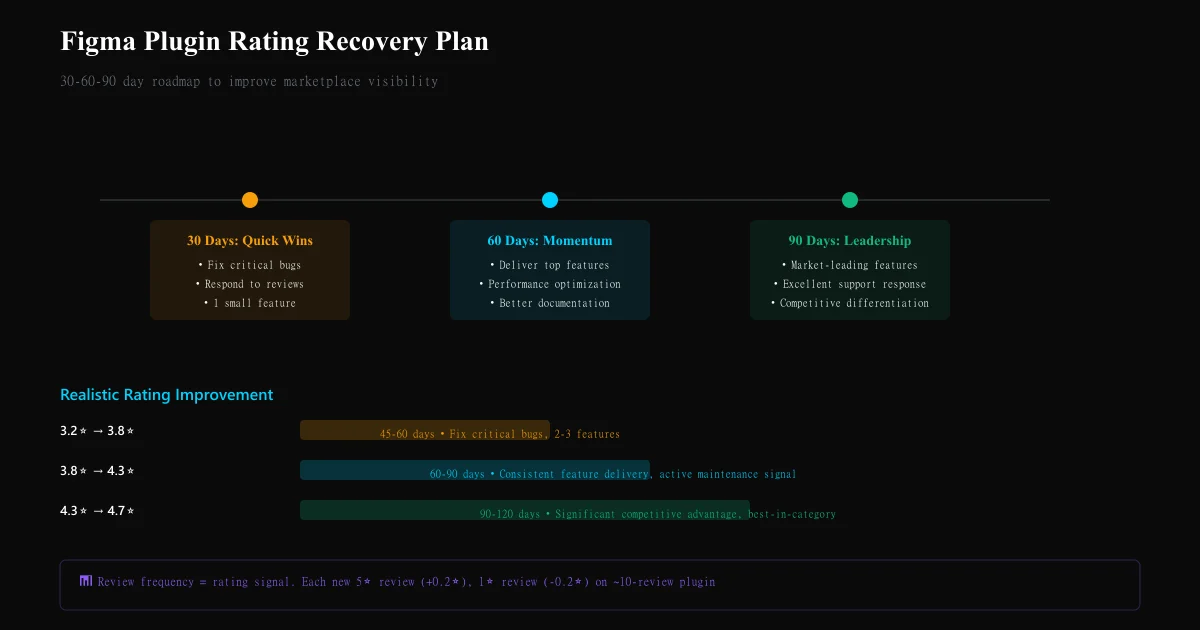
Step 6: Build your 30/60/90 day rating recovery plan
Based on review analysis:
30 days: Quick wins
- Fix any critical crash/functionality bugs (1-star complaints)
- Respond to 1-star reviews with solutions or updates
- Ship one small highly-requested feature from reviews
- Communicate update publicly ("We've heard you...")
Goal: Prevent further rating decline; convert some 2-3 star reviews to 4+
60 days: Feature delivery
- Ship top 2-3 features mentioned in 2-3 star reviews
- Performance optimization if mentioned as issue
- Documentation improvement if UX confusion flagged
Goal: Convert 3-4 star reviews to 4-5 star; maintain new 5-star arrival rate
90 days: Competitive repositioning
- Evaluate: are we addressing market gap that competitor plugins aren't?
- If market leadership possible: invest in feature completeness to jump to 4.7+⭐
- If niche market: become best-in-niche (specific workflow) to achieve 4.8⭐
Goal: Reach 4.5+⭐; establish positive rating trajectory
Plugin rating velocity benchmarks
| Rating improvement | Realistic timeline | Required action | Market impact |
|---|---|---|---|
| 3.2⭐ → 3.8⭐ | 45-60 days | Fix critical bugs, ship 2-3 requested features | Modest marketplace visibility improvement |
| 3.8⭐ → 4.3⭐ | 60-90 days | Consistent feature delivery, active maintenance signal | Noticeable search ranking improvement |
| 4.3⭐ → 4.7⭐ | 90-120 days | Market-leading feature set, excellent support response | Significant competitive advantage |
Common Figma plugin review analysis mistakes
Mistake 1: Ignoring 2-3 star reviews These are your improvement goldmine. A 3-star review saying "great, but missing X" tells you exactly what to ship. 1-star reviews are often just venting.
Mistake 2: Treating all bugs equally A crash = immediate priority. A minor UI inconsistency = backlog. Reviews should inform prioritization by frequency + severity.
Mistake 3: Not responding to negative reviews A bad review responded to thoughtfully (explanation + timeline to fix) influences future readers. Silence confirms the problem.
Mistake 4: Assuming recent reviews represent current state If you shipped a major fix 2 weeks ago but there are old 1-star reviews, new reviews will show the improvement. Don't despair on old reviews.
Mistake 5: Over-investing in low-impact features If one person requests feature X, it's not a priority. Wait for 3+ mentions before investing. Review frequency is signal.
Ready to try AI-powered review analysis?
Get 2 free SWOT reports per month. No credit card required.
Start FreeRelated Articles
Discord communities are invisible to traditional review platforms. Learn how to systematically extract and analyze member sentiment from channels to detect engagement churn, identify friction points, and drive community growth.
Luxury Brand Review Analysis: Understanding High-End Customer Expectations and FeedbackLuxury brands operate with different customer expectations. Learn how to analyze reviews on specialty platforms, separate outcome from process feedback, and detect quality deterioration in high-margin segments.
Review Sentiment Analysis as Churn Prediction: Using Reviews as Leading Indicators for Customer LossChurn prediction using usage metrics is reactive. Learn how to use review sentiment shifts as leading indicators that predict customer churn 30–90 days in advance, enabling proactive retention intervention.